Combine Rows
Aggregate data from multiple rows into a single row. This transformation is similar to a SQL group_by operator.
Parameters
The Combine Rows transformation has three required parameters:
- Row Group Identifiers: The sets of identifier fields used to identify unique row groups. Defaults to [].
Each identifier requires the following options:- type: The type of row group. Examples:
Week,Day,Identity. - Source Column: The column that will be used to identify the group.
- Target Column: The column that will store the row group label.
- type: The type of row group. Examples:
- Source Column: The column name containing the data you want to combine. Defaults to
content. - Destination Column: The column name that will hold the combined data. Defaults to
combined_data. - Combiner Function: Specifies how the data is combined. This is a required field. Currently, the available options are Concatenate or Count.
Usage
To use the Combine Rows transformation in Mantium, follow these steps:
- Select the transformation from the list of available transformations in the Mantium user interface.
- Click on the 'Add +' button next to the Row Group Identifier parameter to configure a row group identifier.
- Select a row group identifier type. For instance, if you want to group rows by month, select
Monthand select a source column with date data. - Select the source column that you want to use for grouping.
- Enter a destination column that will store the row group label.
- Repeat steps 2-5 to add additional columns to be used for grouping.
- Configure the Source Column parameter by selecting the column that you want to combine.
- Configure the Destination Column parameter by specifying the name of the new column that will be created with the combined data.
- Select the Combiner Function: Concatenate or Count.
- Run the transformation by clicking the Save and Run Transforms button. The resulting dataset will have the specified rows combined.
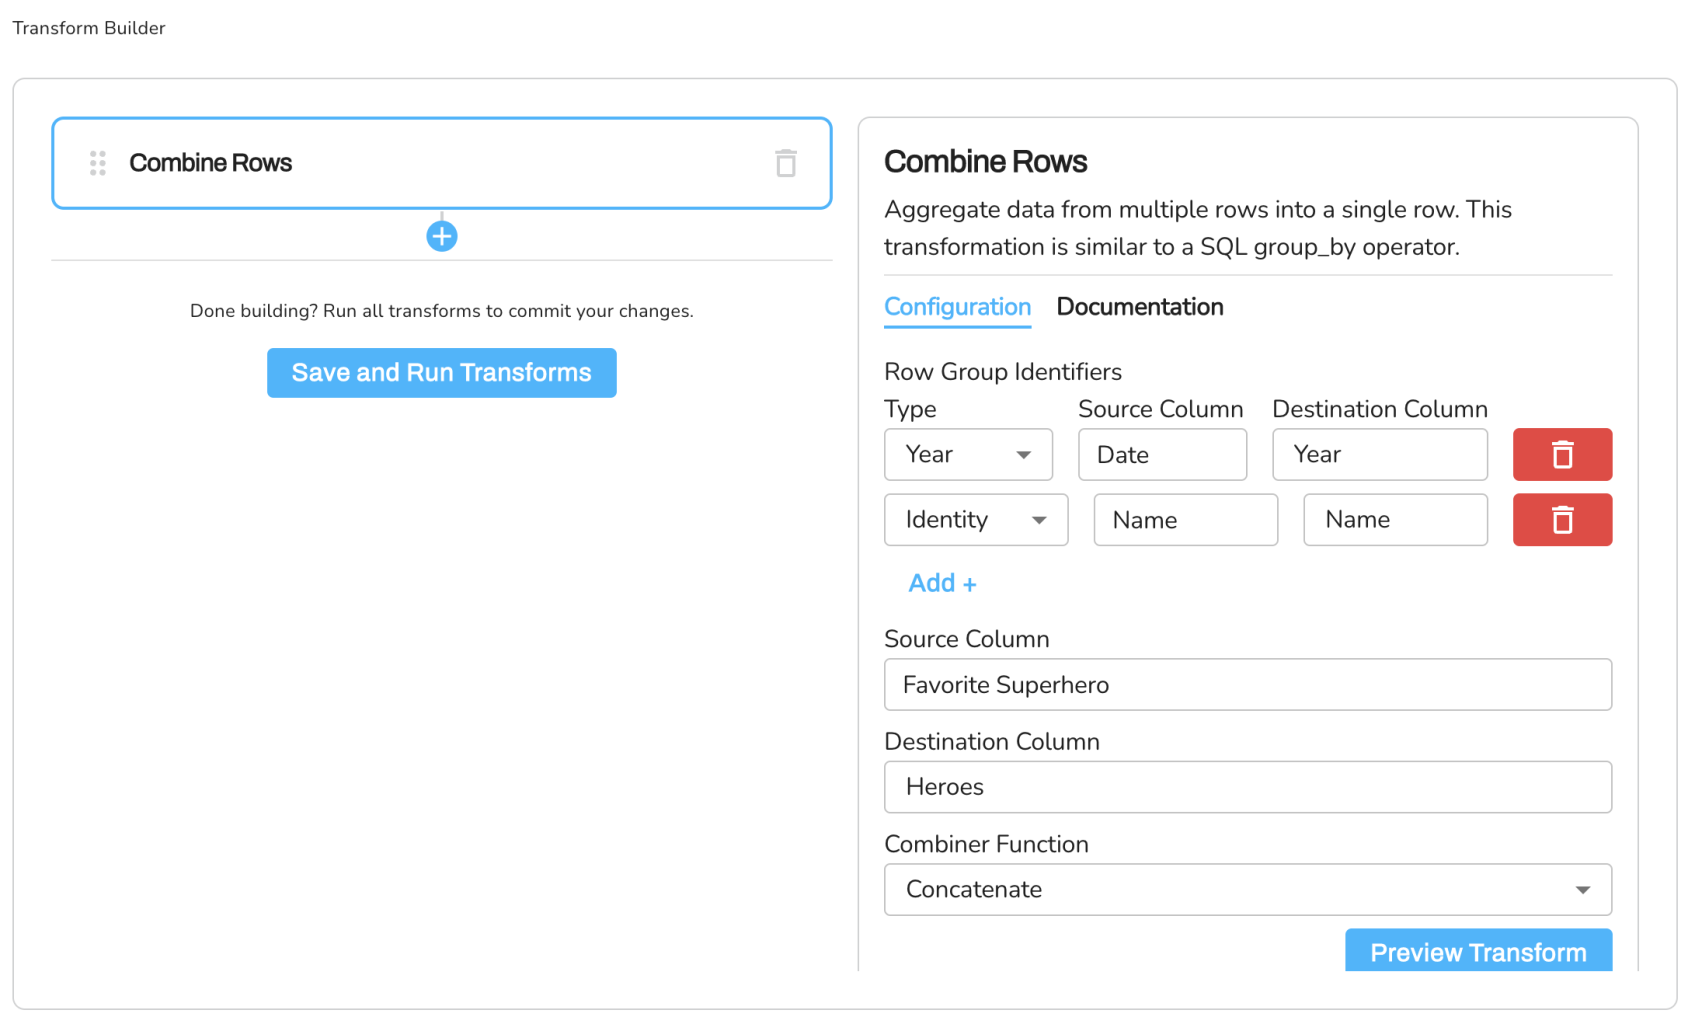
Example 1: Combining Favorite Superheroes by Year and Name
Use Case
Suppose we have a dataset containing people's favorite superheroes, and we want to combine the rows based on the same year and name, creating a new column called 'Heroes' that shows all the favorite superheroes for each group.
Sample Dataset
| Name | Date | Gender | Occupation | Favorite Superhero |
|---|---|---|---|---|
| John | 2023-02-01 | Male | Engineer | Batman |
| Jane | 2022-10-06 | Female | Doctor | Ironman |
| John | 2023-05-02 | Male | Engineer | She-Hulk |
| Jill | 2024-08-09 | Female | Doctor | Superman |
Config as YAML
Row Group Identifiers:
  - type: Year
    source_column: Date
    destination_column: Year
  - type: Identity
    source_column: Name
    target_column: Name
Source Column: Favorite Superhero
Destination Column: Heroes
Combiner Function: Concatenate
Expected Result Dataset
| Year | Name | Heroes |
|---|---|---|
| 2022 | Jane | Ironman |
| 2023 | John | Batman; She-Hulk |
| 2024 | Jill | Superman |
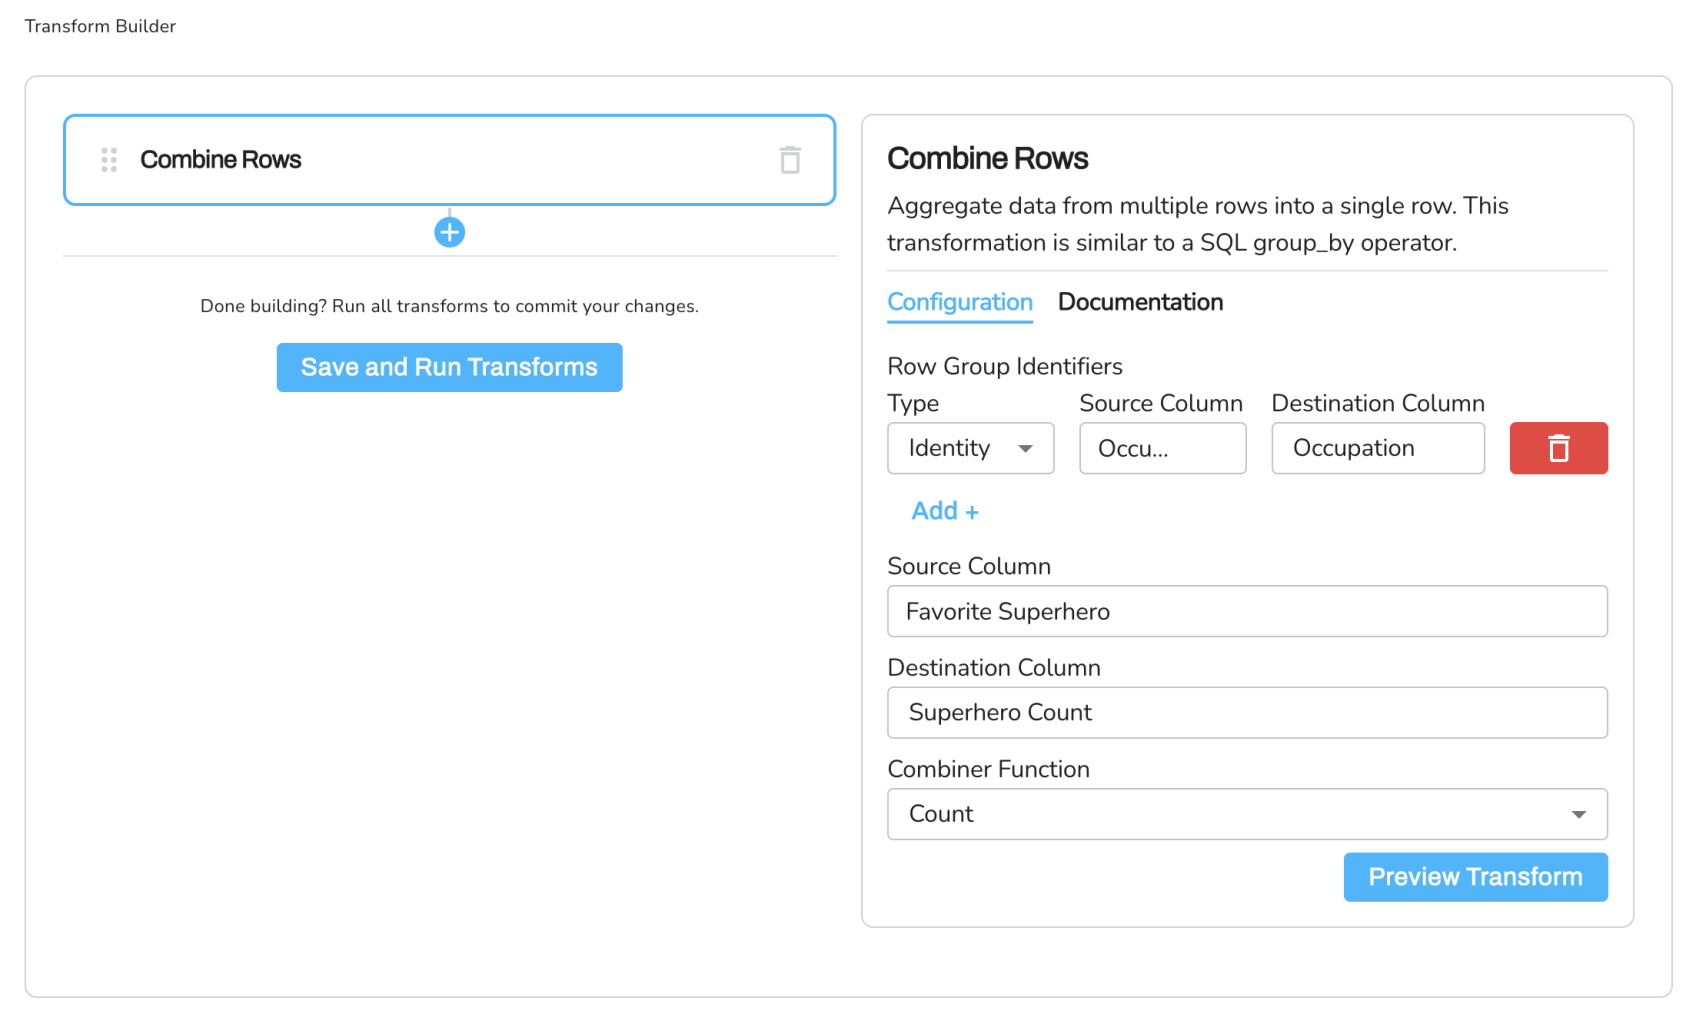
Example 2: Counting Superheroes by Occupation
Use Case
Suppose we have the same dataset as in Example 1 and we want to count the number of superheroes listed for each occupation.
Sample Dataset
| Name | Date | Gender | Occupation | Favorite Superhero |
|---|---|---|---|---|
| John | 2023-02-01 | Male | Engineer | Batman |
| Jane | 2022-10-06 | Female | Doctor | Ironman |
| John | 2023-05-02 | Male | Engineer | She-Hulk |
| Jill | 2024-08-09 | Female | Doctor | Superman |
In Example 2, we are working with the same dataset as in Example 1, which contains information about people's favorite superheroes. The goal of this example is to count the number of superheroes listed for each occupation in the dataset.
The Combine Rows transformation is configured with the following parameters:
- Row Group Identifiers: We are using the Identity type to group rows by the "Occupation" column. The resulting dataset will have one row for each unique occupation.
- Source Column: We choose the "Favorite Superhero" column as the source column. This column contains the superhero names we want to count for each occupation.
- Target Column: We create a new column called "Superhero Count" to store the count of superheroes for each unique occupation.
- Combiner Function: We select the "Count" combiner function to count the number of superhero entries for each occupation group.
When the transformation is executed, it groups the dataset by the unique occupation values (in this case, "Engineer" and "Doctor") and counts the number of superhero entries in each group. The resulting dataset shows the count of superheroes for each occupation:
Config as YAML
Row Group Identifiers:
  - type: Identity
    source_column: Occupation
    target_column: Occupation
Source Column: Favorite Superhero
Target Column: Superhero Count
Combiner Function: Count
Expected Result Dataset
| Occupation | Superhero Count |
|---|---|
| Engineer | 2 |
| Doctor | 2 |
Updated about 3 years ago